Author : INSTANA
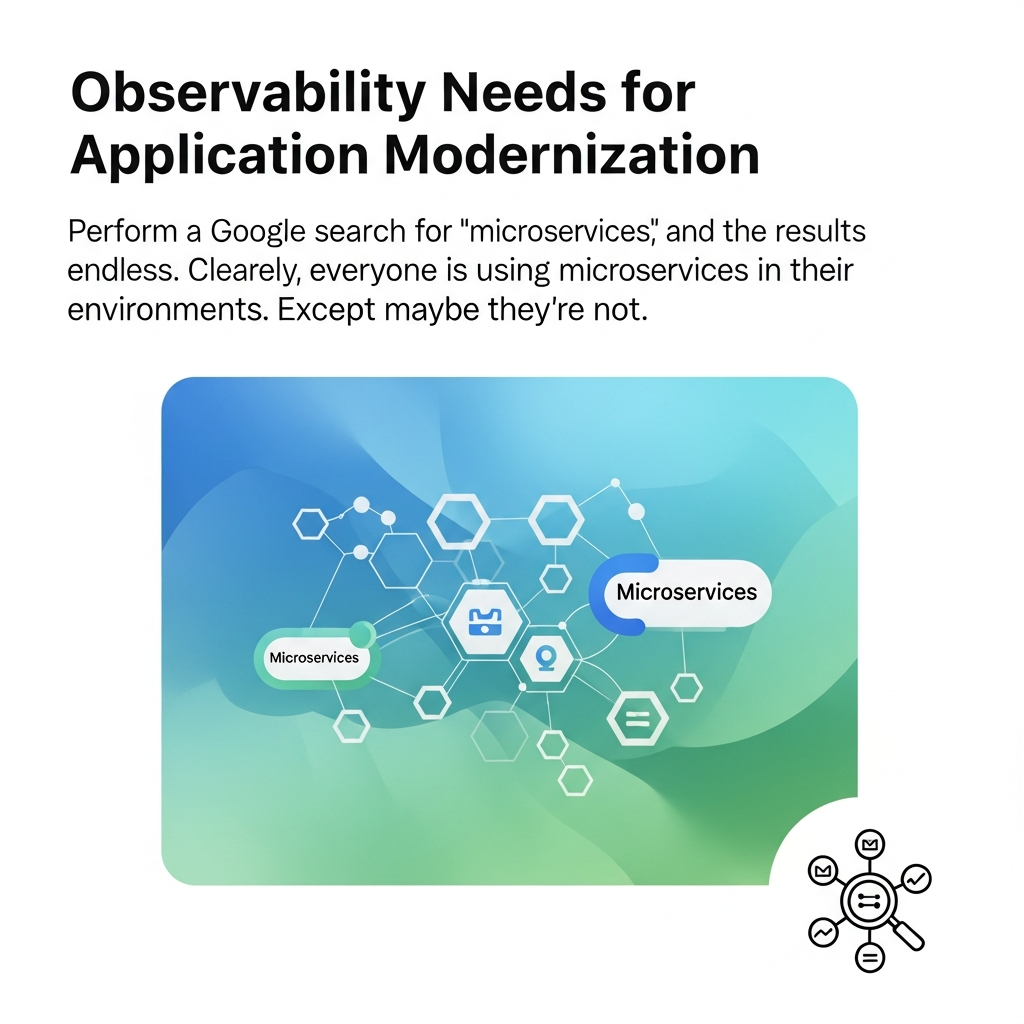
Observability Needs for Application Modernization
Summary
Application modernization initiatives, particularly those involving microservices, demand robust observability. This guide explores the critical observability needs for successful modernization, emphasizing the importance of comprehensive monitoring, tracing, and logging. You’ll learn how to implement effective observability strategies to gain deep insights into your applications’ performance and health, ultimately ensuring a smooth transition and optimized operations.
Introduction
You’re embarking on a journey to modernize your applications, a path that often leads to microservices, containerization, and cloud-native architectures. This transformation promises increased agility, scalability, and resilience. However, this journey also introduces significant complexity. Traditional monitoring tools often fall short in these modern environments, leaving you blind to critical issues.
That’s where observability comes in. Observability provides the insights you need to understand what’s happening inside your systems. It’s the ability to ask questions about your system’s state based on the data it produces. Observability is not just about monitoring; it’s about understanding the “why” behind the “what.” This understanding is crucial for diagnosing problems, optimizing performance, and ensuring a smooth transition during application modernization.
The Core Pillars of Observability
To achieve effective observability, you need to focus on three core pillars:
- Metrics: These are numerical data points that describe the state of your system at a specific point in time. Think of CPU usage, memory consumption, request latency, and error rates. Metrics provide a quantitative view of your application’s performance.
- Logs: Logs are time-stamped records of events that occur within your system. They provide rich context and detail, helping you understand the sequence of events leading up to a problem. Logs can include application events, security events, and system events.
- Tracing: Distributed tracing tracks the flow of a request as it traverses multiple services in a microservices architecture. It allows you to pinpoint the exact service and component where a performance bottleneck or error occurred.
Key Factors for Effective Observability in Application Modernization
Here are the key factors you should consider when implementing observability:
- Comprehensive Monitoring: Implement monitoring across all layers of your application stack, from infrastructure to application code. Monitor key performance indicators (KPIs) and set up alerts for critical thresholds.
- Distributed Tracing: Implement distributed tracing to track requests across microservices. This allows you to quickly identify performance bottlenecks and troubleshoot issues in complex systems.
- Centralized Logging: Aggregate logs from all your services and infrastructure in a centralized location. This makes it easier to search, analyze, and correlate events.
- Automated Alerting: Set up automated alerts based on metrics and log patterns. This enables you to proactively identify and address issues before they impact your users.
- Data Visualization: Use dashboards and visualizations to gain insights into your application’s performance and health. This makes it easier to spot trends and identify areas for improvement.
- Contextualization: Enrich your metrics, logs, and traces with contextual information, such as user IDs, request IDs, and service names. This makes it easier to understand the impact of issues and troubleshoot them effectively.
- Scalability: Choose observability tools that can scale to handle the volume and velocity of data generated by your modern applications.
Tips for Improving Observability
Here are some practical tips to enhance your observability efforts:
- Instrument Your Code: Add instrumentation to your code to generate custom metrics, logs, and traces. This allows you to gain deep insights into your application’s behavior.
- Choose the Right Tools: Select observability tools that are well-suited for your environment and use case. Consider open-source options like Prometheus, Grafana, and Jaeger, or commercial solutions like Datadog, New Relic, and Splunk.
- Define Service Level Objectives (SLOs): Establish SLOs to measure the performance of your services from the perspective of your users. This helps you prioritize observability efforts and ensure that your applications are meeting their goals.
- Embrace Infrastructure as Code: Automate the deployment and configuration of your observability tools using infrastructure-as-code principles. This ensures consistency and repeatability.
- Train Your Team: Invest in training your team on observability principles and tools. This will help them to effectively use the data generated by your observability systems.
- Regularly Review and Refine: Observability is an ongoing process. Regularly review your dashboards, alerts, and configurations to ensure they are meeting your needs. Adjust as your application evolves.
Conclusion
Application modernization is a complex undertaking, but with the right approach, you can achieve significant benefits. Implementing robust observability is essential for successfully navigating this transformation. By embracing the principles of monitoring, tracing, and logging, and by following the key factors and tips outlined in this guide, you can gain deep insights into your applications, troubleshoot issues quickly, and optimize performance. Ultimately, robust observability empowers you to build and operate more reliable, scalable, and resilient applications.
Frequently Asked Questions (FAQ)
- What is the difference between monitoring and observability?Monitoring focuses on predefined metrics and alerts, while observability provides a broader view of your system’s internal state. Observability enables you to ask and answer questions about your system that you didn’t anticipate.
- What tools are available for implementing observability?Numerous tools are available, including open-source options like Prometheus, Grafana, Jaeger, and commercial solutions like Datadog, New Relic, and Splunk. The best choice depends on your specific needs and environment.
- How do I get started with observability?Start by identifying your critical services and key performance indicators (KPIs). Implement basic monitoring and logging. Then, gradually introduce tracing and more advanced features as you become more familiar with the concepts.
- How important is distributed tracing?Distributed tracing is crucial for microservices architectures because it allows you to track requests across multiple services, making it easier to identify performance bottlenecks and troubleshoot issues.
- How do I choose the right observability tools?Consider factors such as your budget, team’s expertise, the size and complexity of your environment, and the specific features you need. Evaluate different tools and choose the ones that best meet your requirements.
“`